Exporting Cycle Summary Reports from Analytics Dashboard
Last updated: May 3, 2026
Accessing and Exporting Analytics Reports
This document describes how to access the Analytics reporting dashboard, review different report categories, filter a Cycle Summary report for the last seven days, export it as a CSV file, and open it for further analysis.
Step 1: Open the Analytics Reporting Dashboard
Navigate to the sidebar, select Analytics, and then click on Reports to open the reporting dashboard.

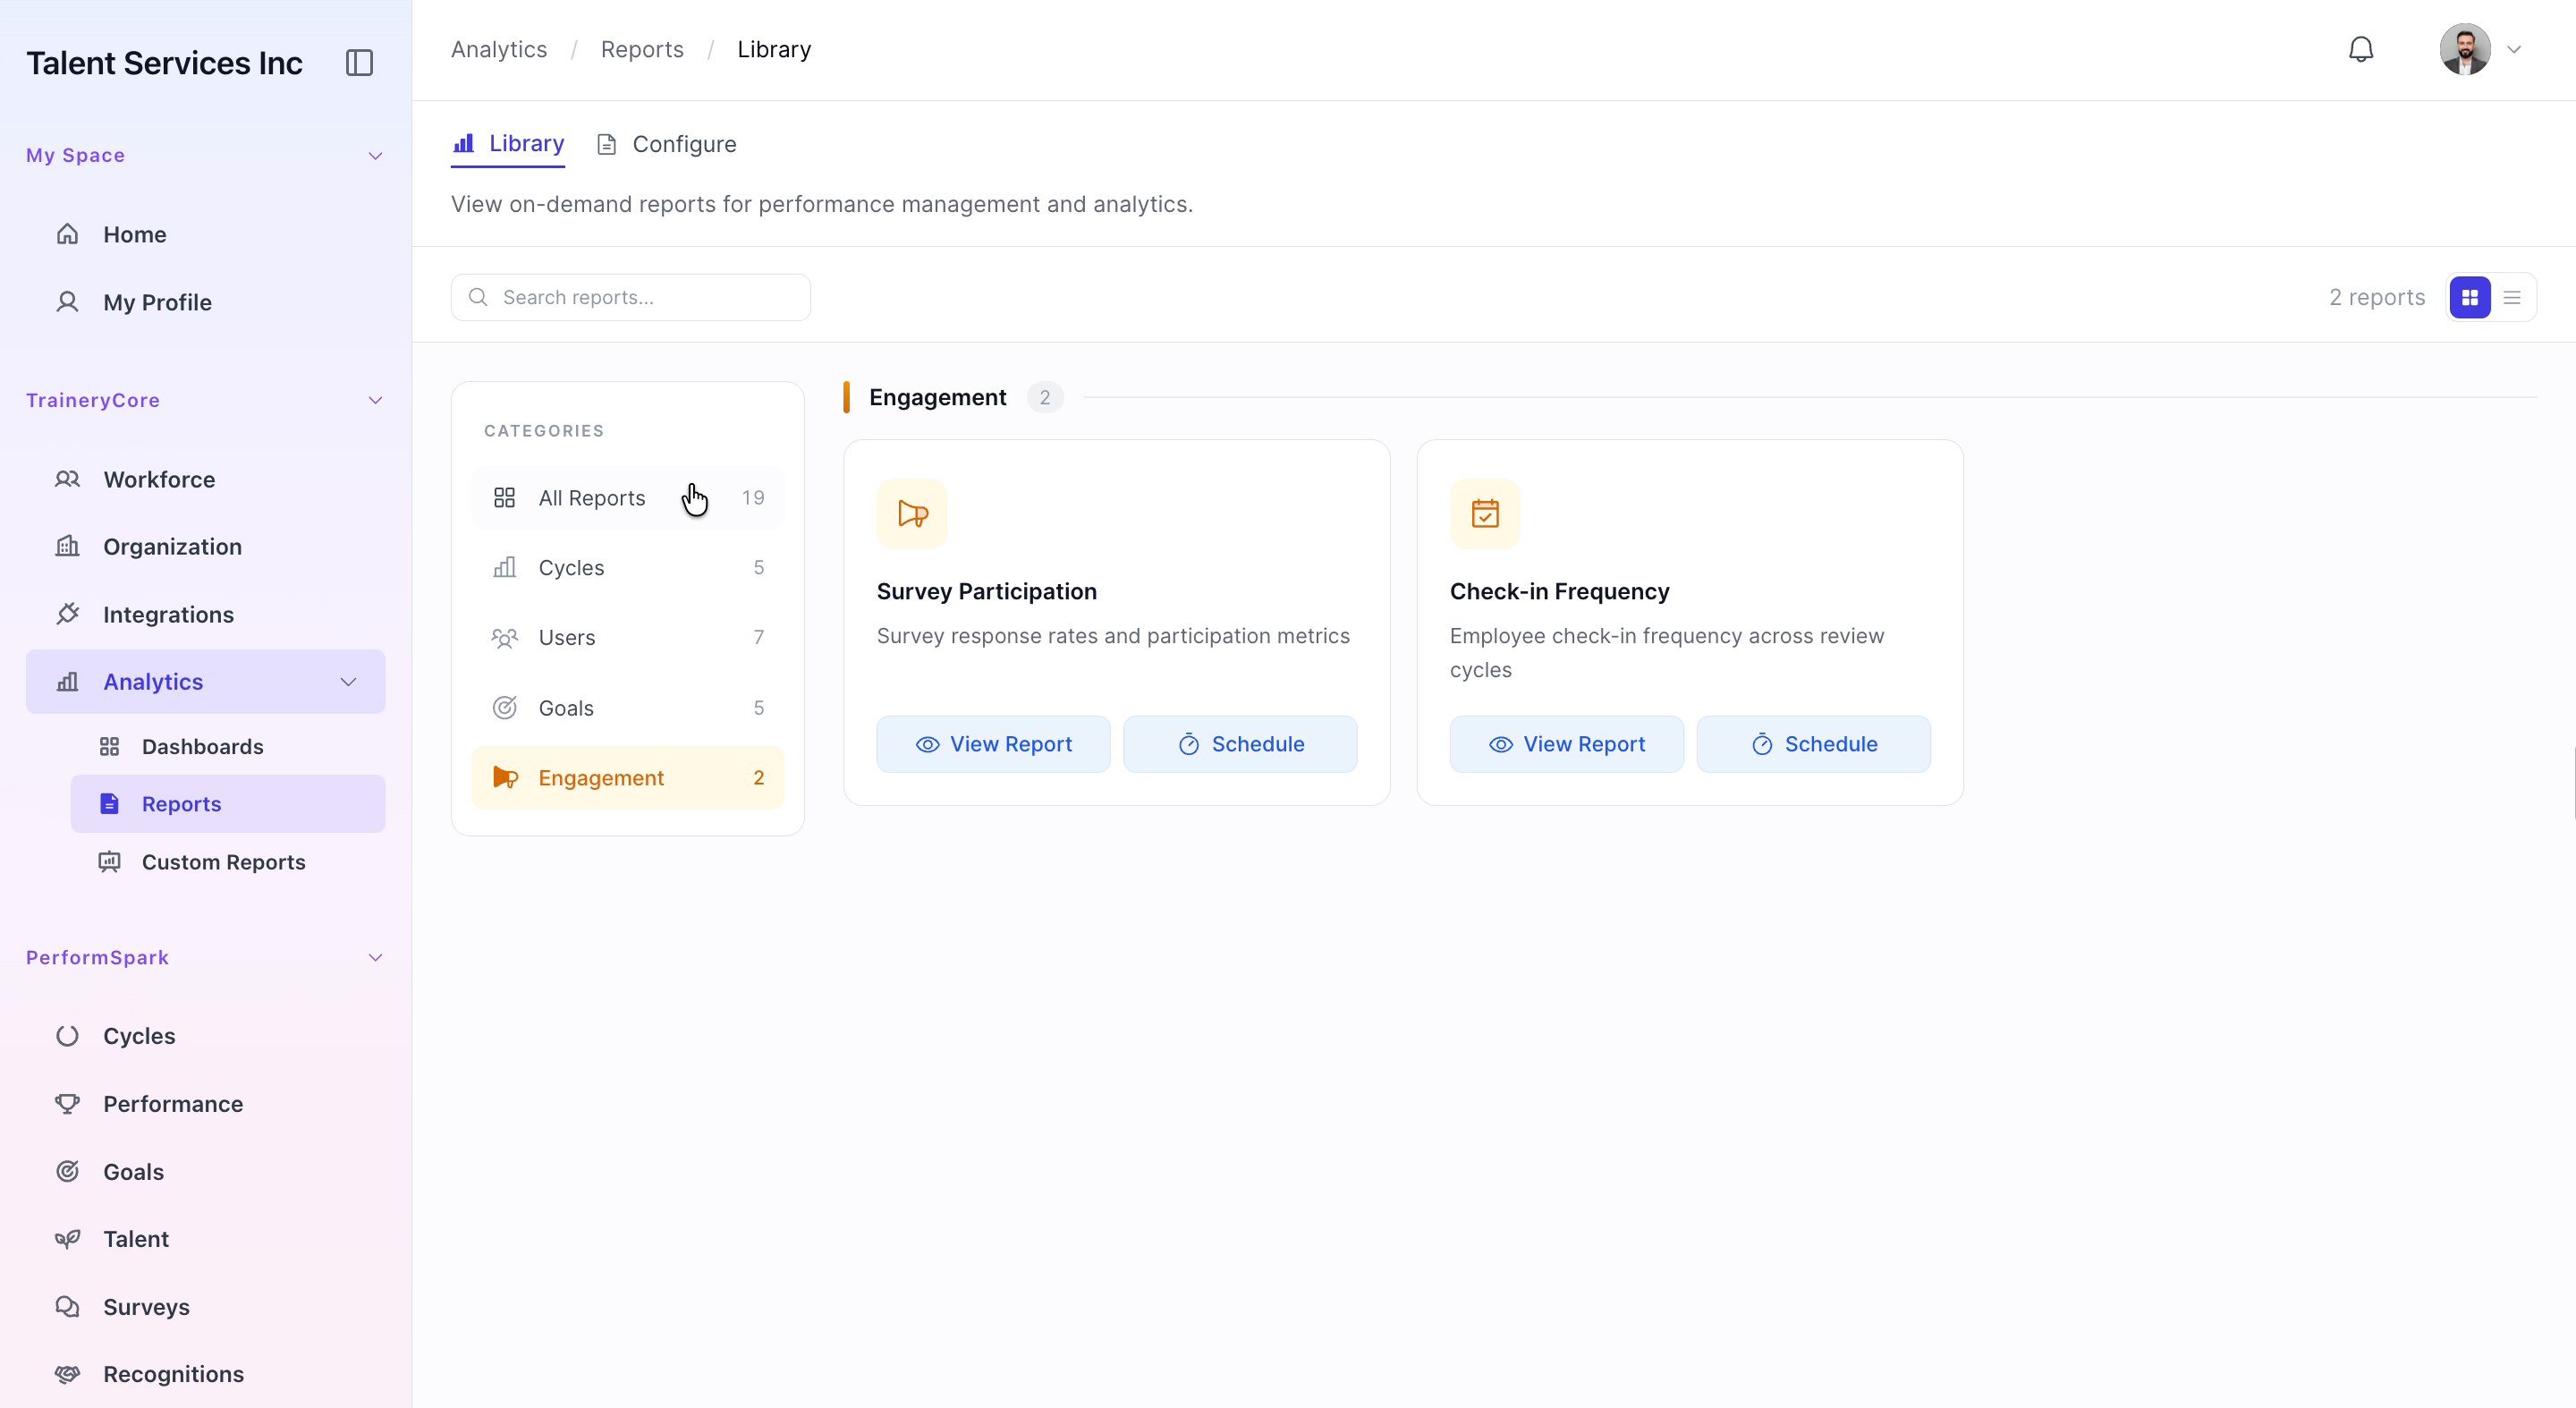
Step 2: Explore Available Report Categories
In the reporting dashboard, review the different report categories (such as Cycles, Users, Goals, and Engagement) to understand the available data summaries and insights you can generate.
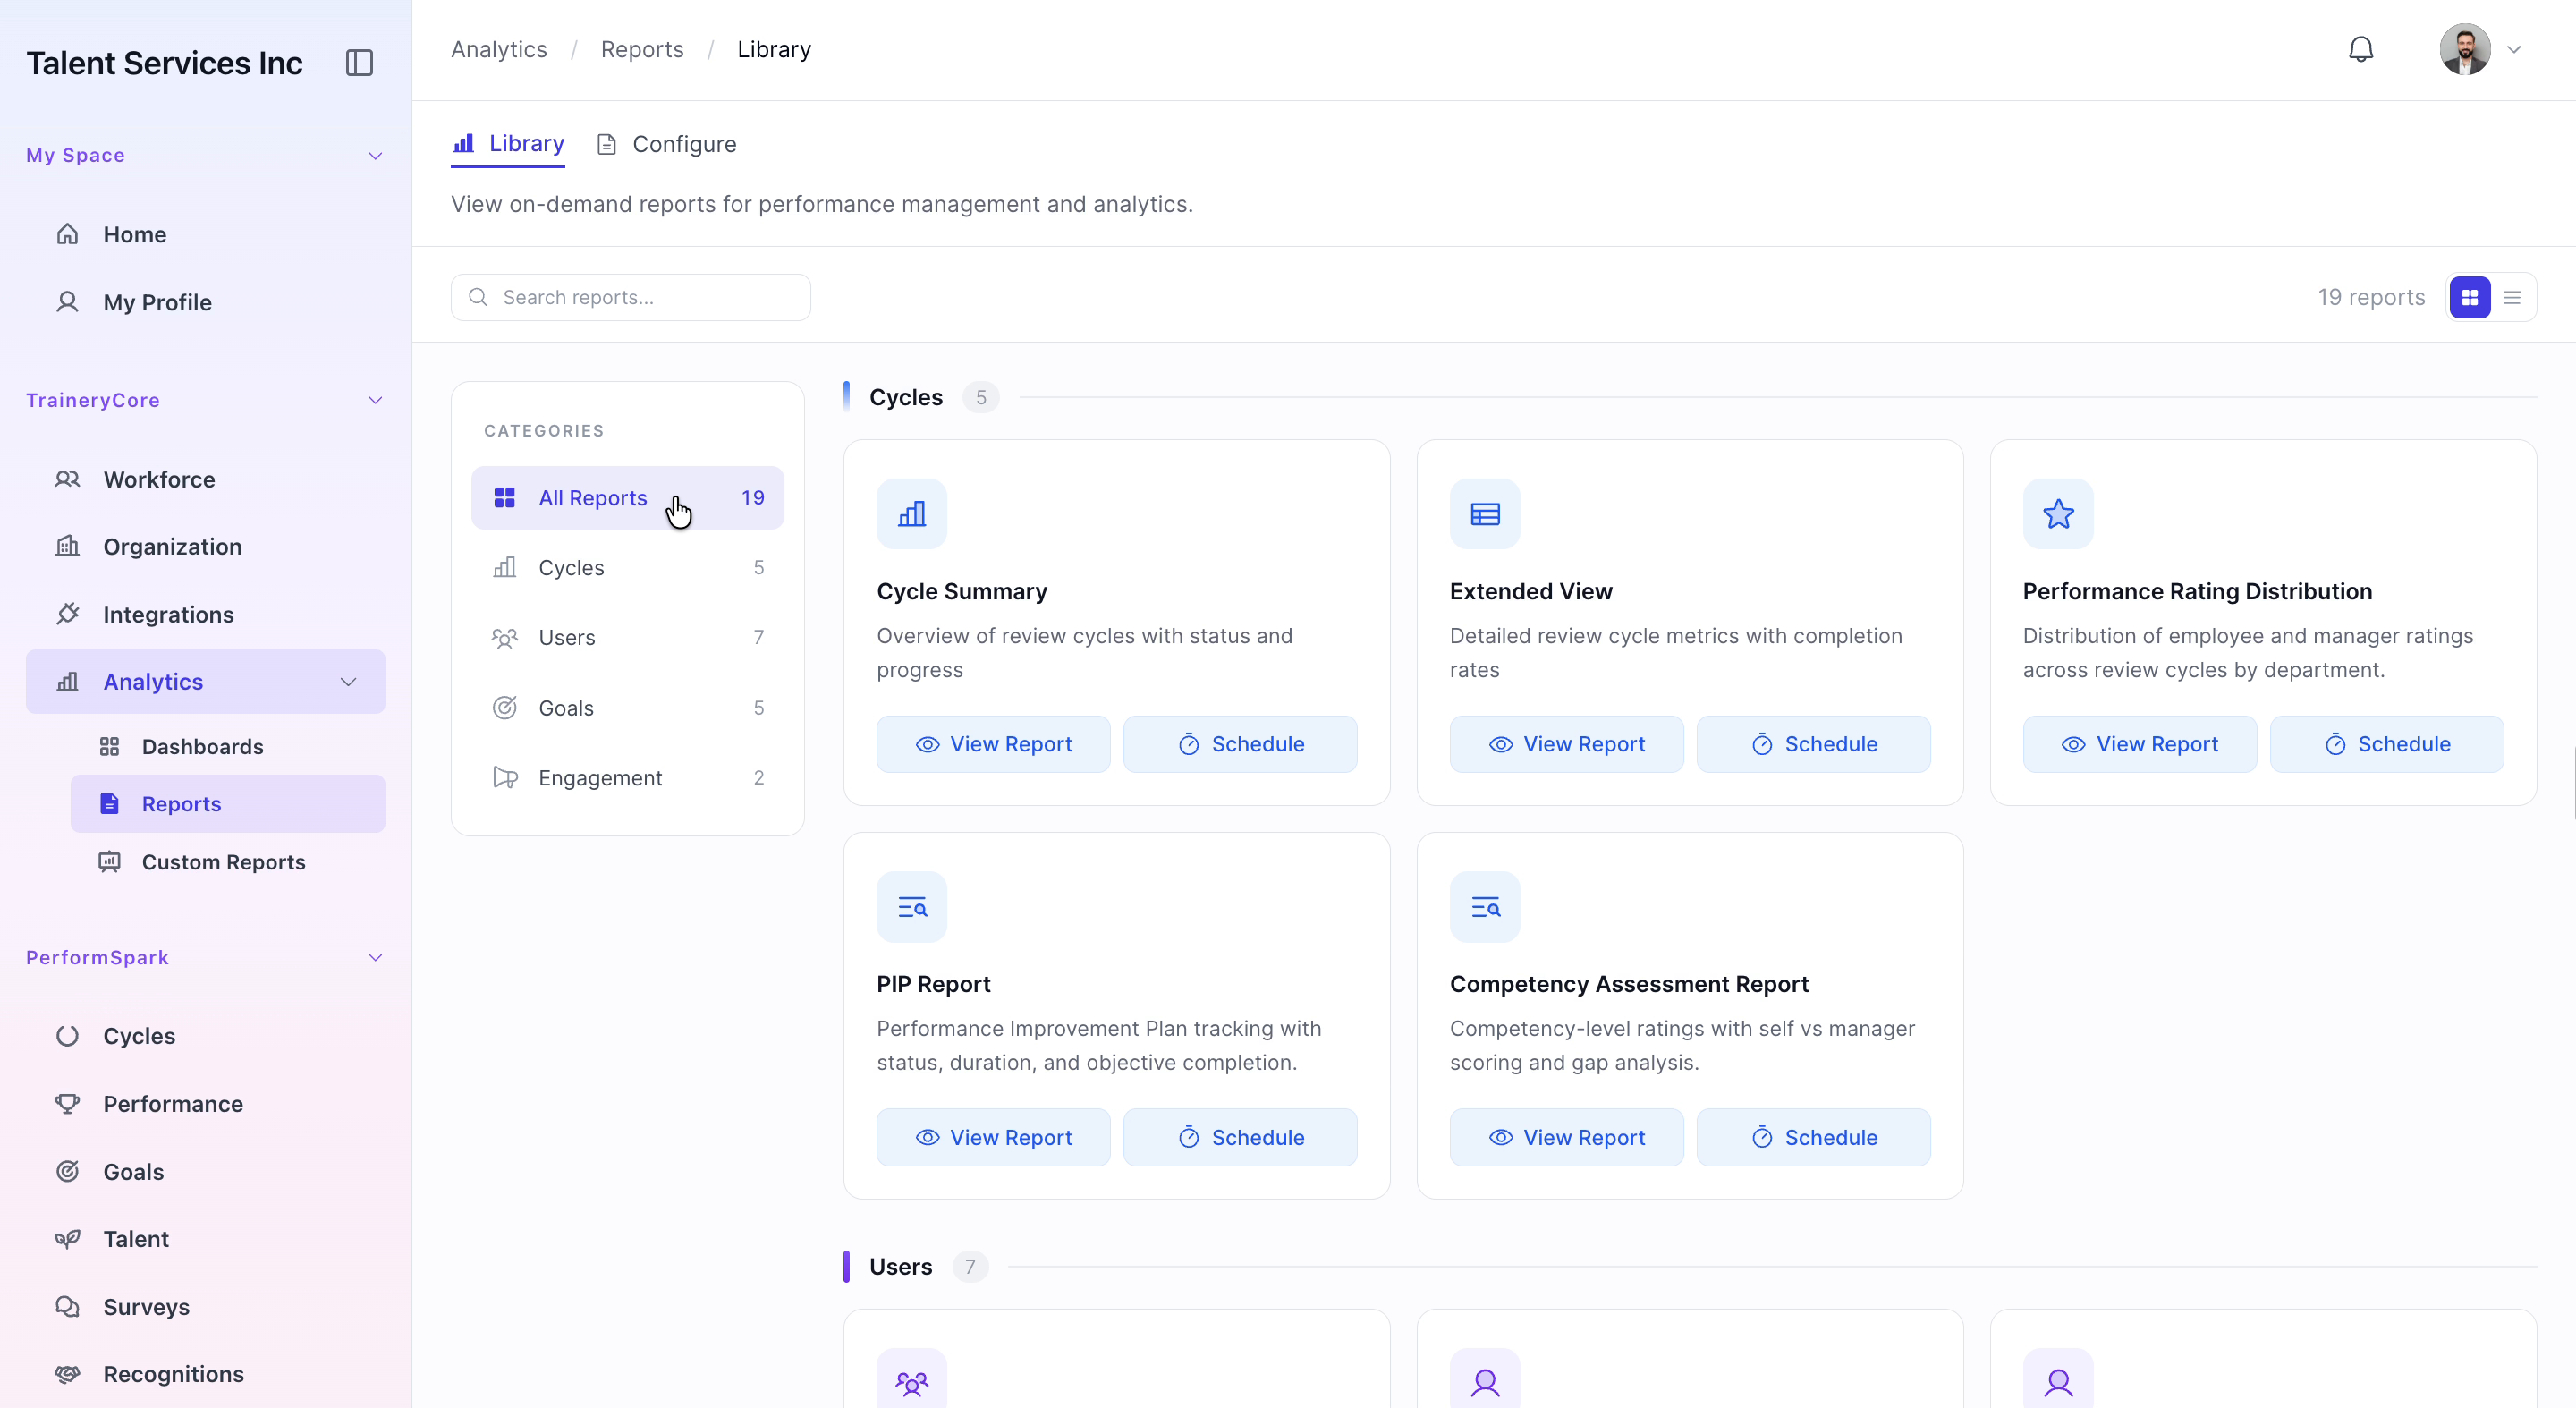

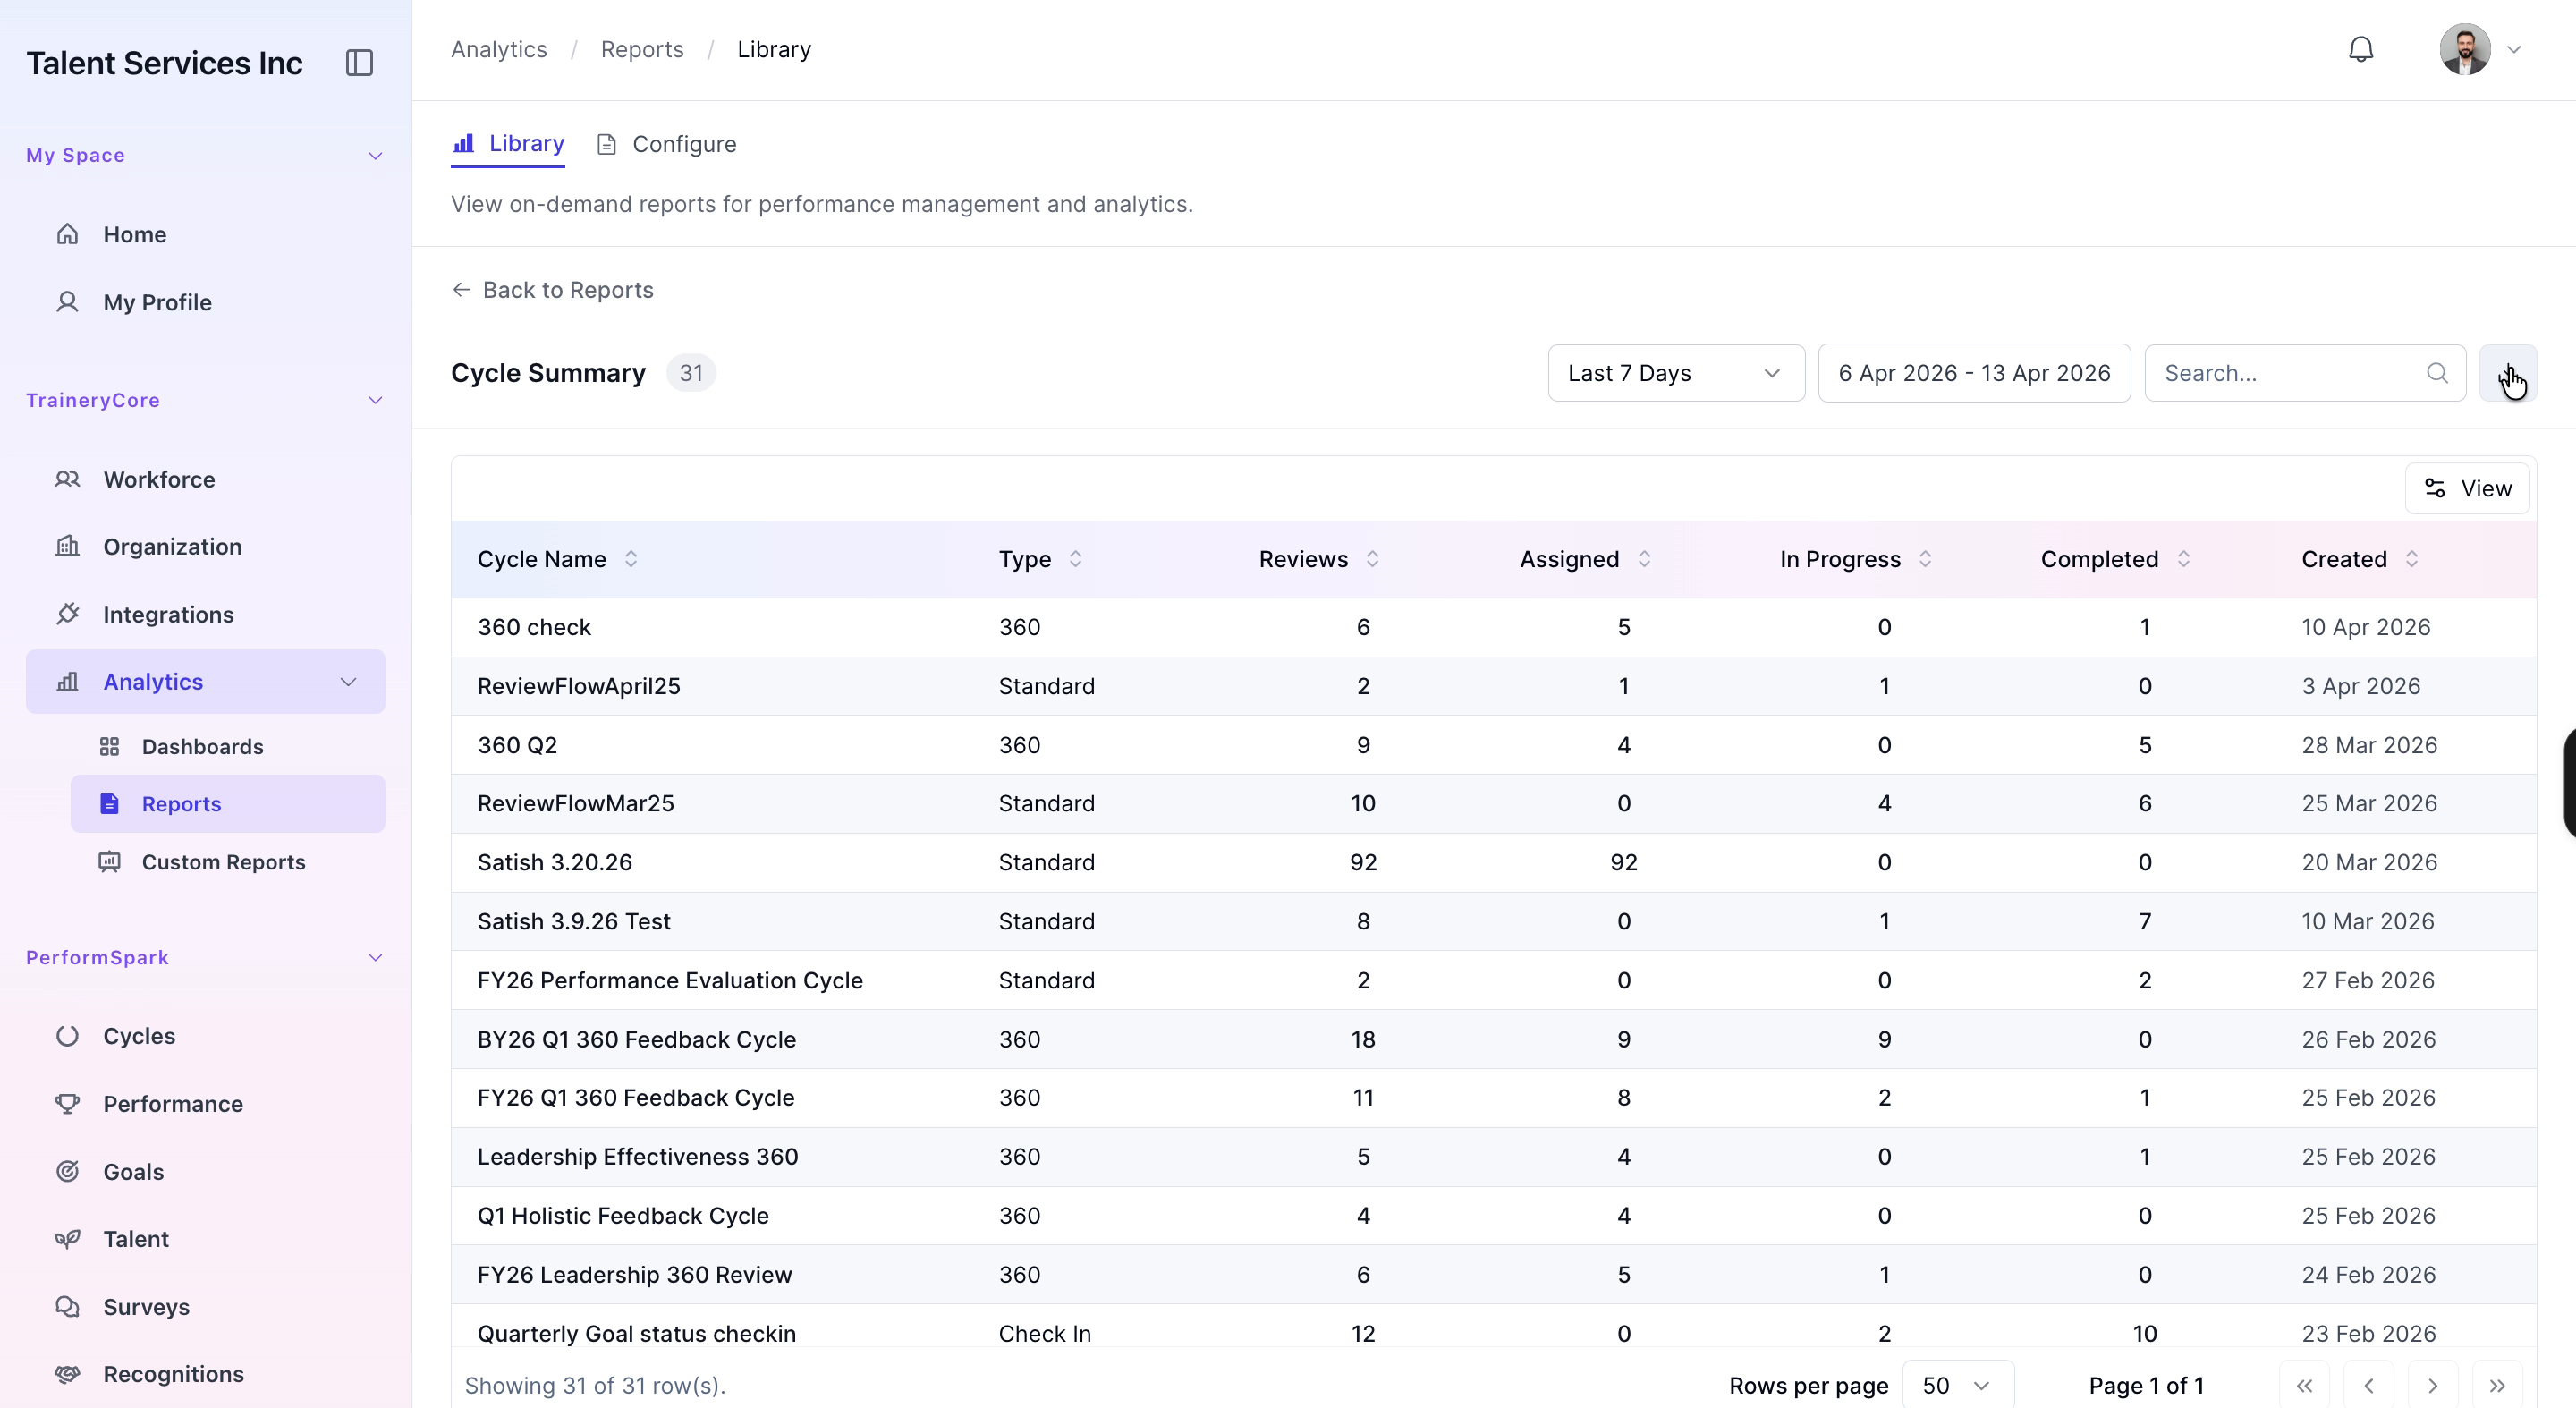
Step 3: View and Filter the Cycle Summary Report
Click View Report for the Cycle Summary category. In the report view, locate the date filter and adjust it to display results from the last seven days, then apply the filter to refresh the data.

Step 4: Export the Filtered Report as CSV
After reviewing the filtered Cycle Summary list, click the download (export) icon at the top right of the report to export the data as a CSV file and save it to your computer.

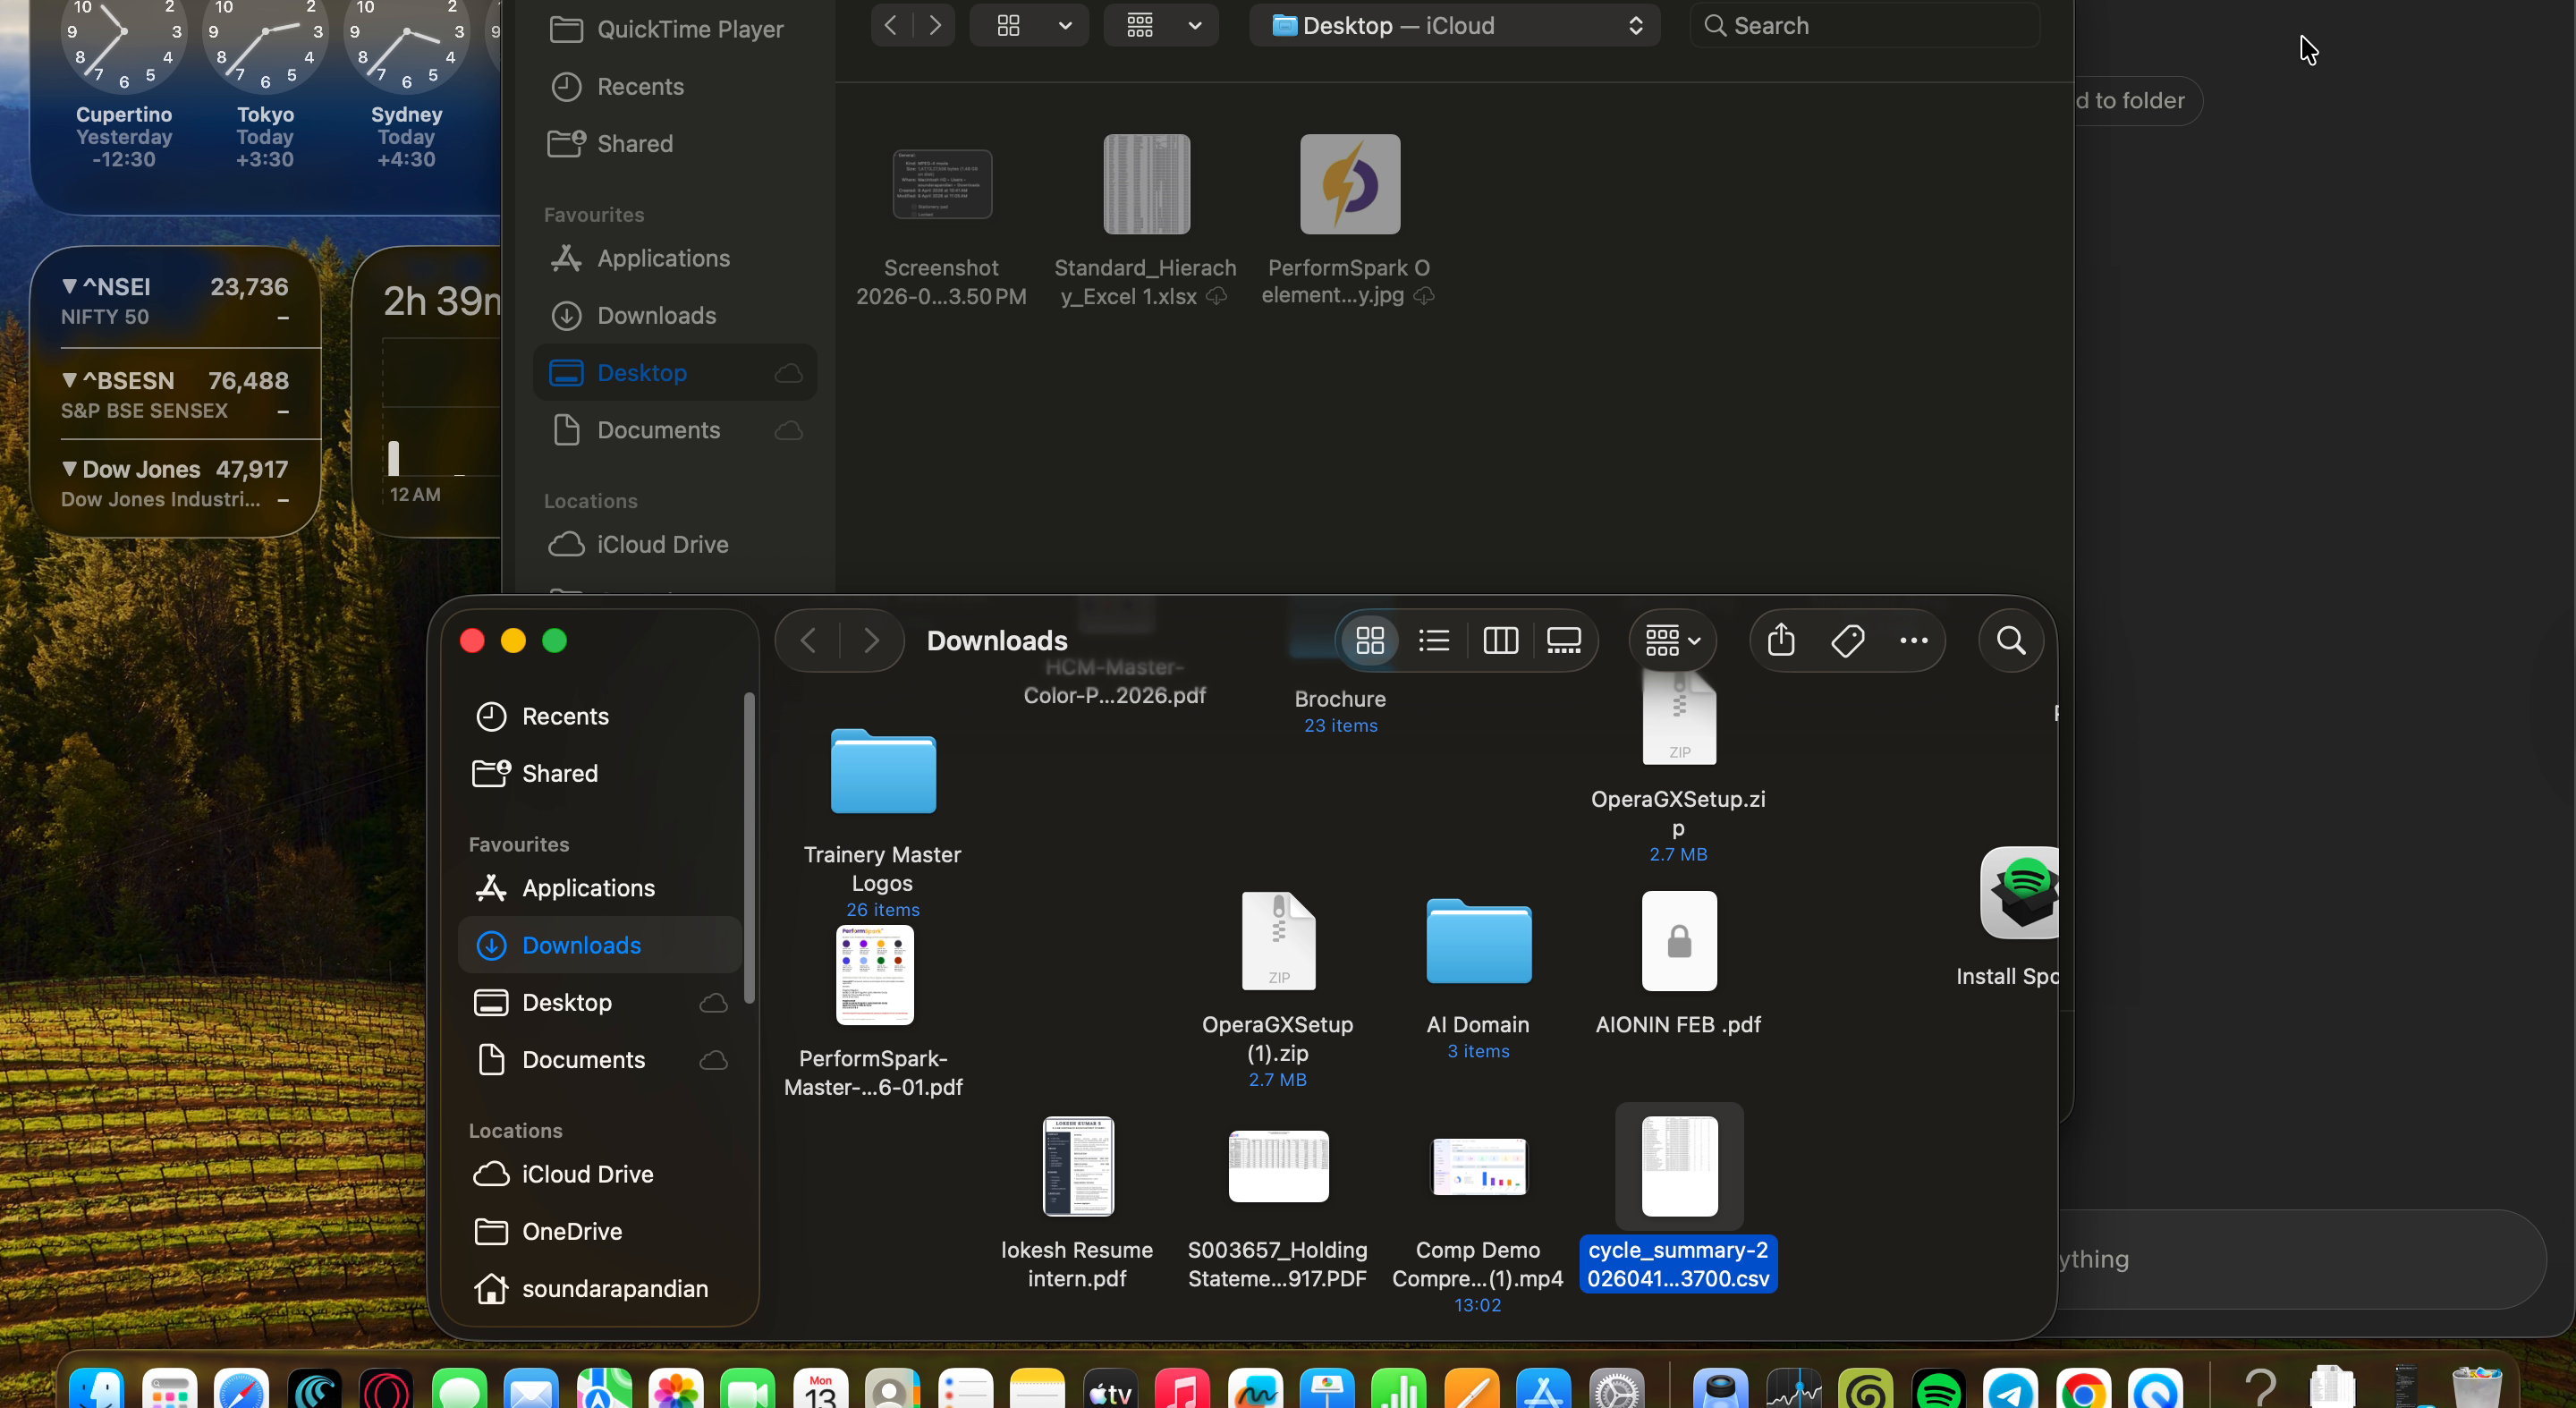
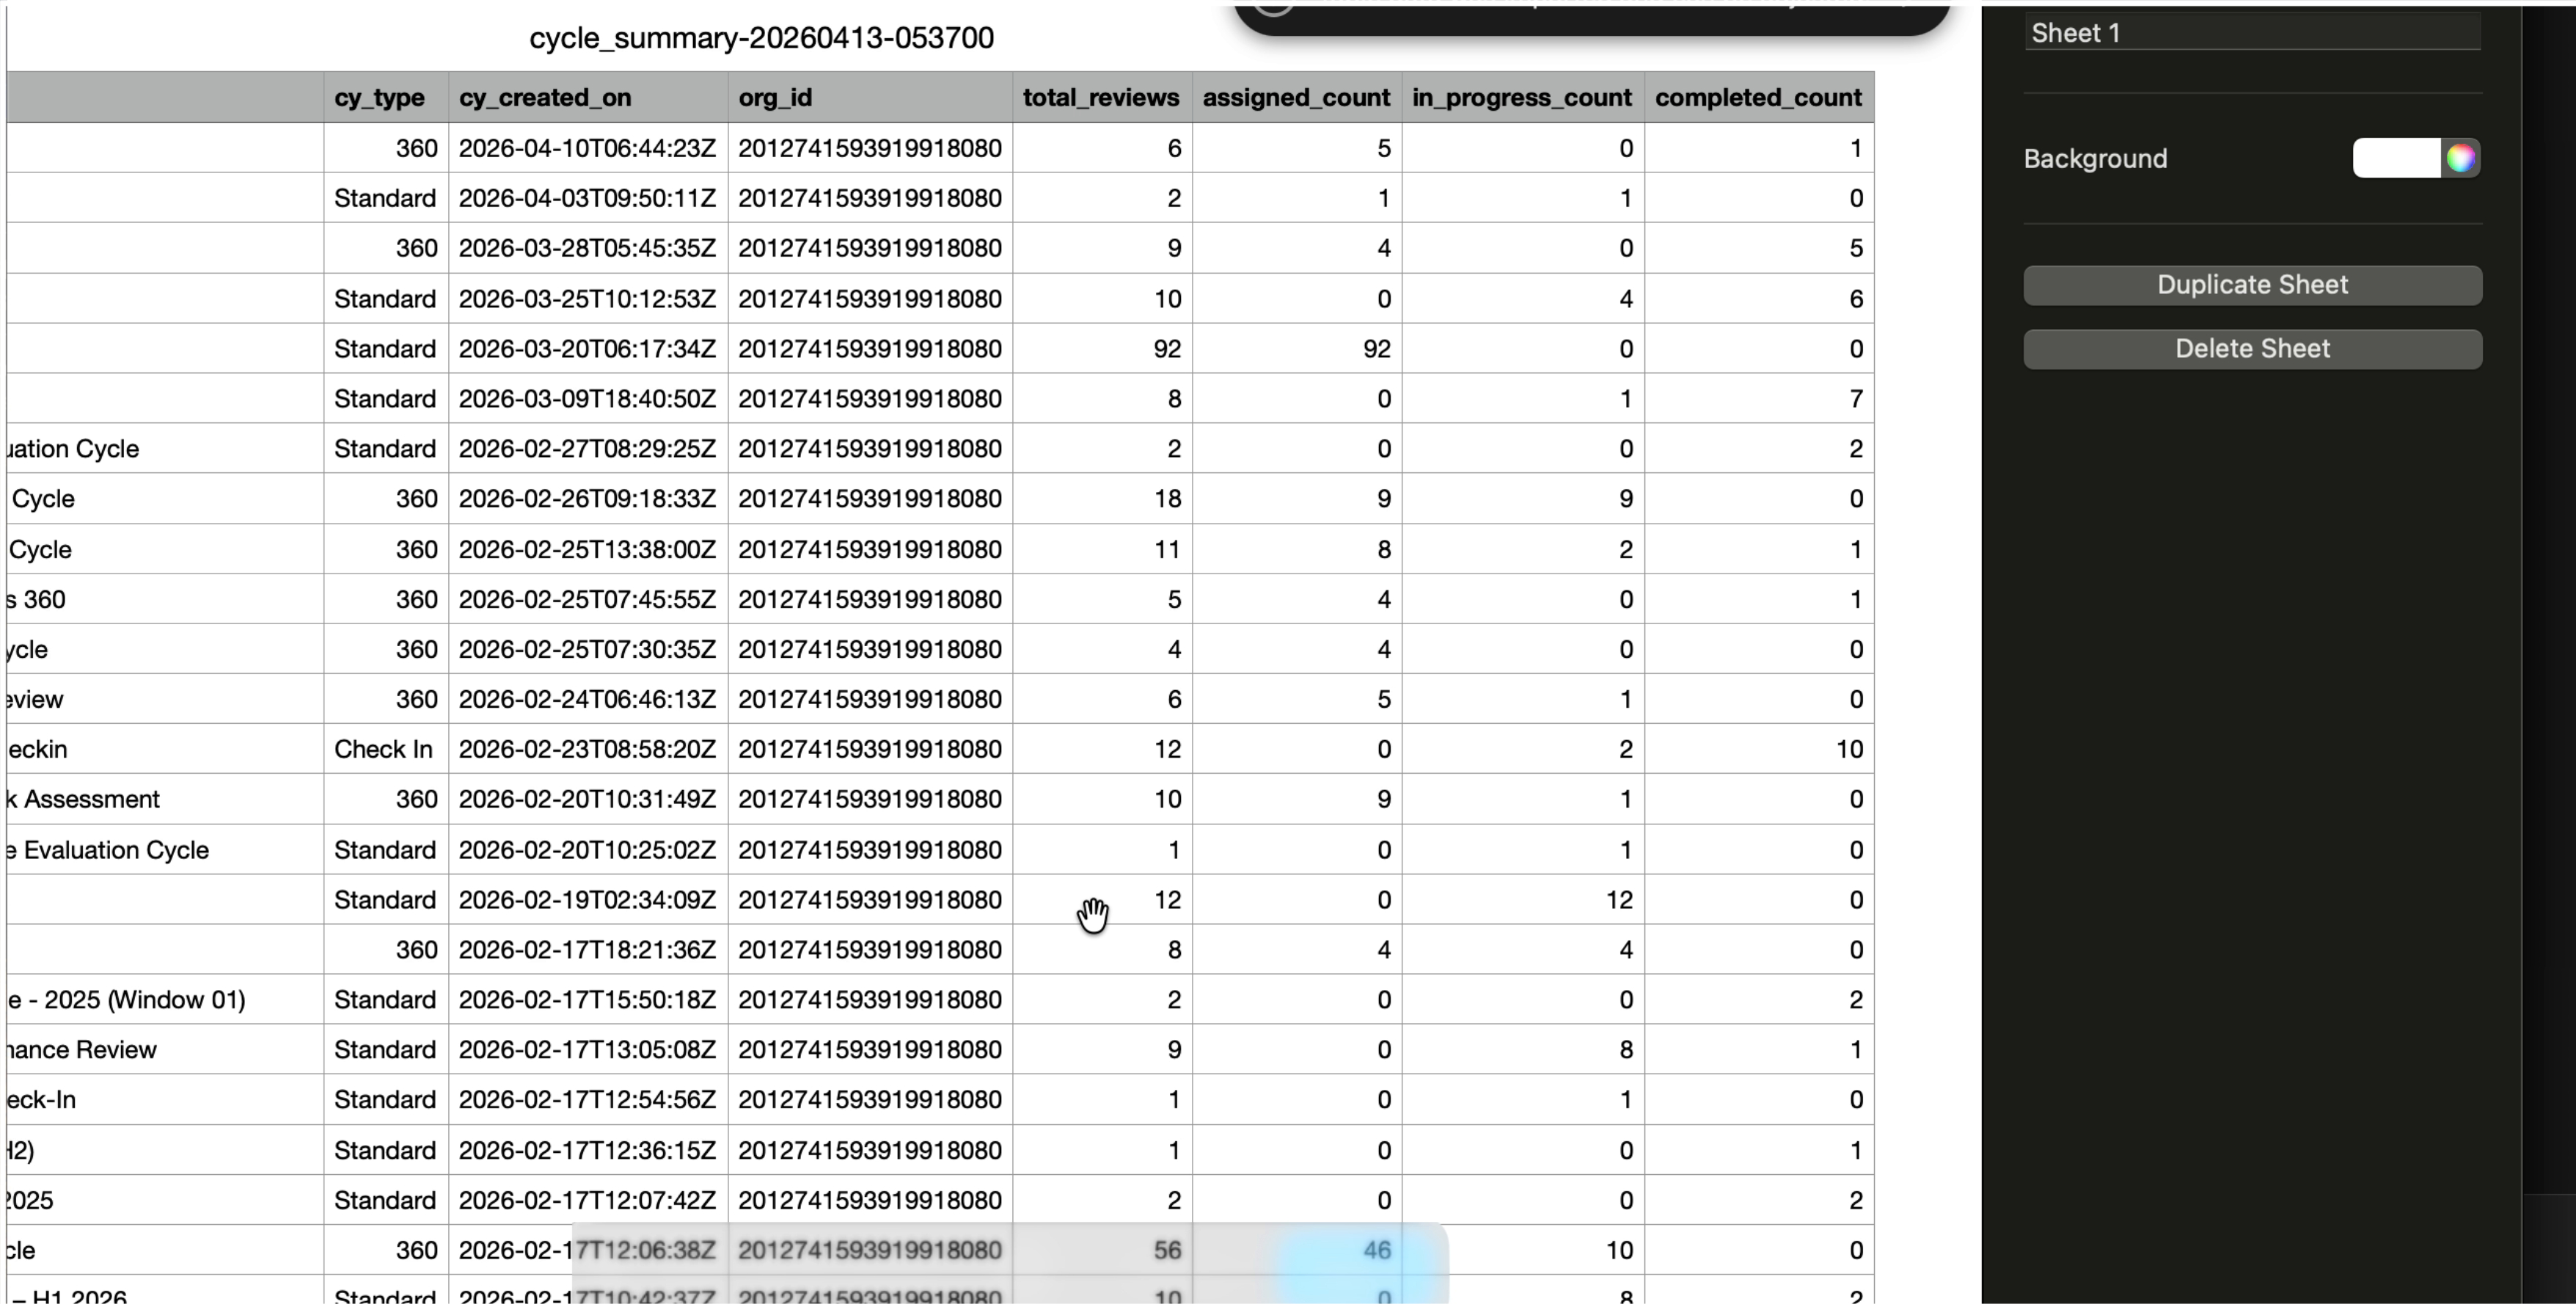
Step 5: Open and Analyze the Downloaded CSV
Locate the downloaded CSV file on your computer, then open it in your preferred spreadsheet application (such as Excel, Google Sheets, or Numbers) to view and analyze the Cycle Summary data in detail.